. 2022 Mar 4;3(3):240–263. doi: 10.1158/2643-3230.BCD-21-0163

Figure 1.

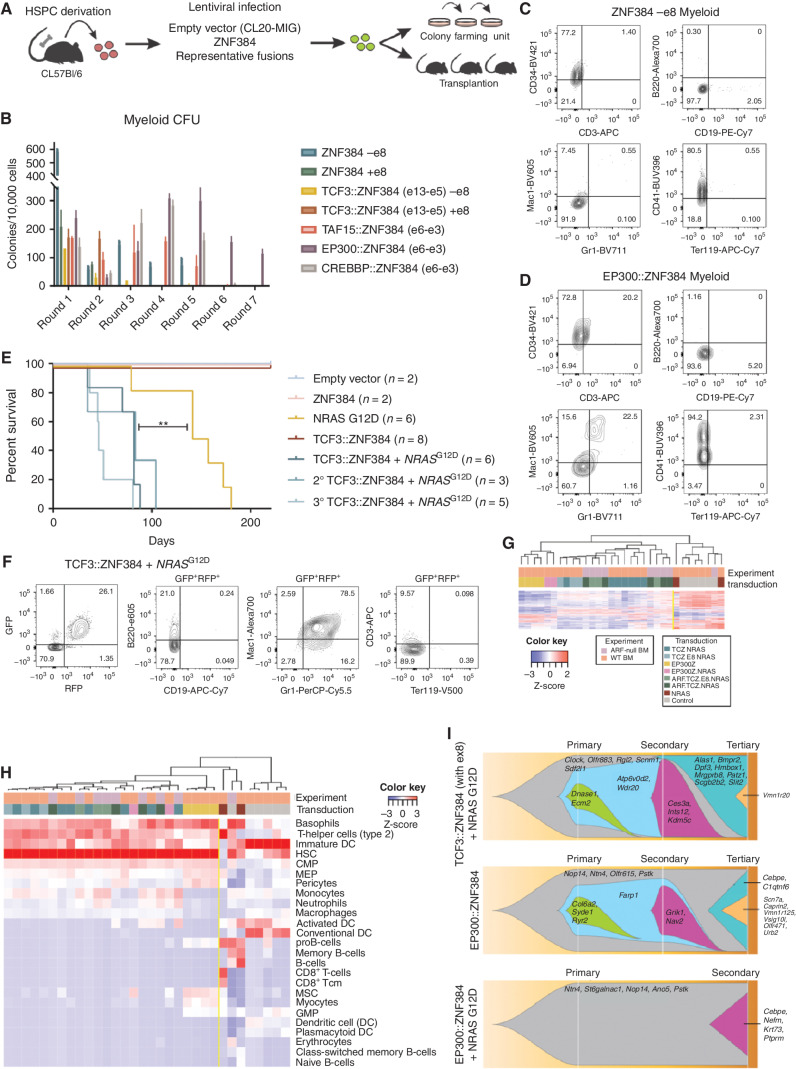
Figure 1. Mouse HSPC transformation by expression of ZNF384 FO. A, The workflow for colony-forming assays and transplantation assays. Bone marrow was isolated from mice, enriched for HSPC, transduced with representative fusions, and sorted for colony-forming assays (CFU) or transplanted directly into mice. B, CFU of lineage-negative bone marrow cells expressing wild-type or FO, with or without exon 8, grown in myeloid differentiation conditions. Columns show means of three replicates ± SD. C, Cells harvested from CFU after two or more replatings were subjected to flow cytometry and representative immunophenotype is shown of wild-type cells (D) or EP300::ZNF384–expressing cell. E, Survival curves in primary, secondary, and tertiary recipients. Two-sided log-rank Mantel–Cox test, **, P  =  0.008, F, Immunophenotyping from a representative mouse (ID 1723) showing tumors harvested from bone marrow expressing Mac1 and Gr1. G, Unsupervised hierarchical clustering of tumors generated in mice. Abbreviations: TCZ.NRAS: TCF3::ZNF384 + NRASG12D; TCZ.E8.NRAS: TCF3::ZNF384 (with exon 8) + NRASG12D; EP300Z.NRAS: EP300::ZNF384 + NRASG12D; ARF.TCZ.NRAS: ARF-null TCF3::ZNF384 + NRASG12D; ARF.TCZ.E8.NRAS: ARF-null TCF3::ZNF384 (with exon 8) + NRASG12D; NRAS: NRASG12D. H, Unsupervised hierarchical clustering xCell analysis showing hematopoietic cell-type signature enrichment. Color legend is the same from G. I, Fishplot of three mouse tumors subjected to exome sequencing showing mutational evolution.

Mouse HSPC transformation by expression of ZNF384 FO. A, The workflow for colony-forming assays and transplantation assays. Bone marrow was isolated from mice, enriched for HSPC, transduced with representative fusions, and sorted for colony-forming assays (CFU) or transplanted directly into mice. B, CFU of lineage-negative bone marrow cells expressing wild-type or FO, with or without exon 8, grown in myeloid differentiation conditions. Columns show means of three replicates ± SD. C, Cells harvested from CFU after two or more replatings were subjected to flow cytometry and representative immunophenotype is shown of wild-type cells (D) or EP300::ZNF384–expressing cell. E, Survival curves in primary, secondary, and tertiary recipients. Two-sided log-rank Mantel–Cox test, **, P  =  0.008, F, Immunophenotyping from a representative mouse (ID 1723) showing tumors harvested from bone marrow expressing Mac1 and Gr1. G, Unsupervised hierarchical clustering of tumors generated in mice. Abbreviations: TCZ.NRAS: TCF3::ZNF384 + NRASG12D; TCZ.E8.NRAS: TCF3::ZNF384 (with exon 8) + NRASG12D; EP300Z.NRAS: EP300::ZNF384 + NRASG12D; ARF.TCZ.NRAS: ARF-null TCF3::ZNF384 + NRASG12D; ARF.TCZ.E8.NRAS: ARF-null TCF3::ZNF384 (with exon 8) + NRASG12D; NRAS: NRASG12D. H, Unsupervised hierarchical clustering xCell analysis showing hematopoietic cell-type signature enrichment. Color legend is the same from G. I, Fishplot of three mouse tumors subjected to exome sequencing showing mutational evolution.