Figure 1.
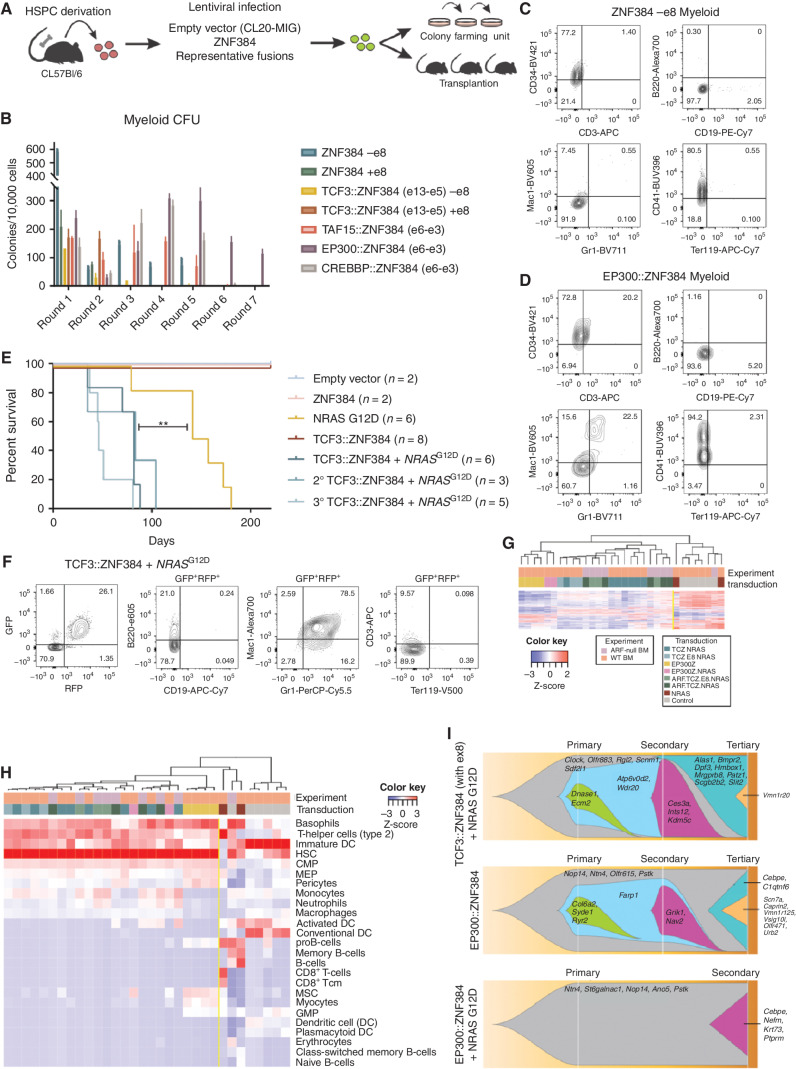
Mouse HSPC transformation by expression of ZNF384 FO. A, The workflow for colony-forming assays and transplantation assays. Bone marrow was isolated from mice, enriched for HSPC, transduced with representative fusions, and sorted for colony-forming assays (CFU) or transplanted directly into mice. B, CFU of lineage-negative bone marrow cells expressing wild-type or FO, with or without exon 8, grown in myeloid differentiation conditions. Columns show means of three replicates ± SD. C, Cells harvested from CFU after two or more replatings were subjected to flow cytometry and representative immunophenotype is shown of wild-type cells (D) or EP300::ZNF384–expressing cell. E, Survival curves in primary, secondary, and tertiary recipients. Two-sided log-rank Mantel–Cox test, **, P = 0.008, F, Immunophenotyping from a representative mouse (ID 1723) showing tumors harvested from bone marrow expressing Mac1 and Gr1. G, Unsupervised hierarchical clustering of tumors generated in mice. Abbreviations: TCZ.NRAS: TCF3::ZNF384 + NRASG12D; TCZ.E8.NRAS: TCF3::ZNF384 (with exon 8) + NRASG12D; EP300Z.NRAS: EP300::ZNF384 + NRASG12D; ARF.TCZ.NRAS: ARF-null TCF3::ZNF384 + NRASG12D; ARF.TCZ.E8.NRAS: ARF-null TCF3::ZNF384 (with exon 8) + NRASG12D; NRAS: NRASG12D. H, Unsupervised hierarchical clustering xCell analysis showing hematopoietic cell-type signature enrichment. Color legend is the same from G. I, Fishplot of three mouse tumors subjected to exome sequencing showing mutational evolution.

