. 2022 Mar 4;3(3):240–263. doi: 10.1158/2643-3230.BCD-21-0163

Figure 6.

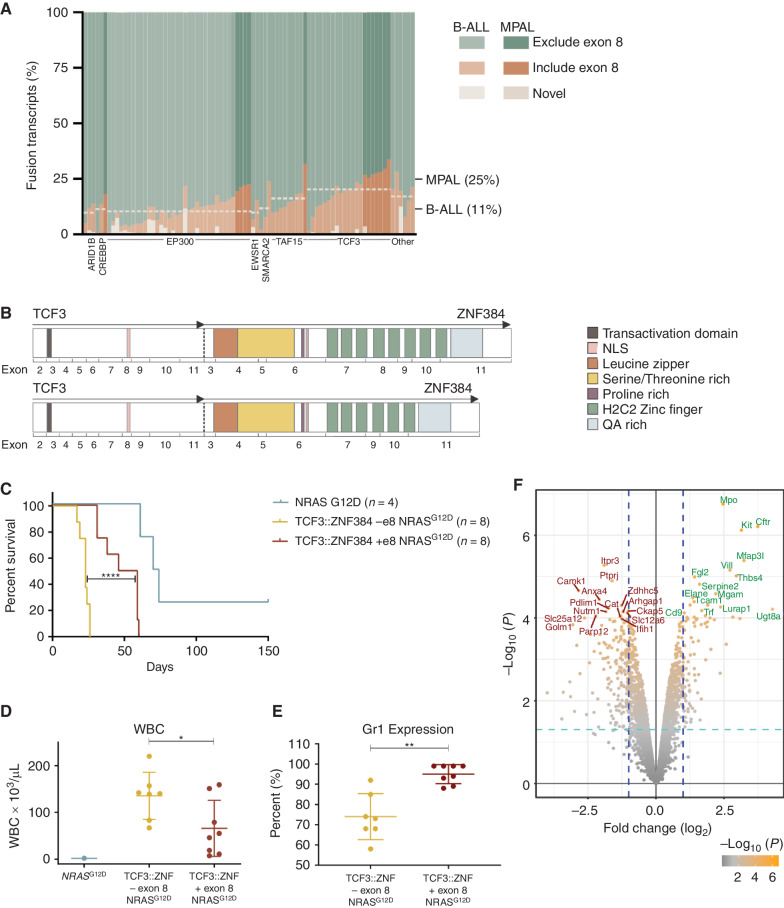
Figure 6. The effect of TCF3::ZNF384 alternative splicing isoforms. A, Relative abundance of ZNF384 splice isoforms in ZNF384r B-ALL and MPAL. Each column represents a case and shows the cumulative abundance of all isoforms as a proportion within each case. The mean inclusion of exon 8 based on N-terminal partner is marked by the horizontal line across cases including that partner. TCF3::ZNF384 fusions have a higher mean exon 8 inclusion rate. Light cases were diagnosed as B-ALL and darker cases as MPAL, with the mean exon 8 inclusion for each diagnosis marked on the left. MPAL cases have a higher average exon 8 inclusion rate. B, A schematic representation of TCF3::ZNF384 mRNA splicing isoforms that differ in exon 8 inclusion. C, Survival curves in primary recipients transplanted with indicated cells. Two-sided log-rank Mantel–Cox test; ****, P < 0.0001. D, White blood cell (WBC) count at death in mice transplanted with indicated cells. The mean expression is shown by the horizontal line in the scatter dot plot and the error bars represent the SD. *, P = 0.0315. E, Percent of cells expressing Gr1 as determined by flow analysis. The mean expression is shown by the horizontal line in the scatter dot plot and the error bars represent the SD; **, P = 0.0042. F, A volcano plot displaying −log10 P value by log2 fold change to compare gene expression of tumors driven by TCF3::ZNF384 with exon 8 to TCF3::ZNF384 without exon 8.

The effect of TCF3::ZNF384 alternative splicing isoforms. A, Relative abundance of ZNF384 splice isoforms in ZNF384r B-ALL and MPAL. Each column represents a case and shows the cumulative abundance of all isoforms as a proportion within each case. The mean inclusion of exon 8 based on N-terminal partner is marked by the horizontal line across cases including that partner. TCF3::ZNF384 fusions have a higher mean exon 8 inclusion rate. Light cases were diagnosed as B-ALL and darker cases as MPAL, with the mean exon 8 inclusion for each diagnosis marked on the left. MPAL cases have a higher average exon 8 inclusion rate. B, A schematic representation of TCF3::ZNF384 mRNA splicing isoforms that differ in exon 8 inclusion. C, Survival curves in primary recipients transplanted with indicated cells. Two-sided log-rank Mantel–Cox test; ****, P < 0.0001. D, White blood cell (WBC) count at death in mice transplanted with indicated cells. The mean expression is shown by the horizontal line in the scatter dot plot and the error bars represent the SD. *, P = 0.0315. E, Percent of cells expressing Gr1 as determined by flow analysis. The mean expression is shown by the horizontal line in the scatter dot plot and the error bars represent the SD; **, P = 0.0042. F, A volcano plot displaying −log10P value by log2 fold change to compare gene expression of tumors driven by TCF3::ZNF384 with exon 8 to TCF3::ZNF384 without exon 8.