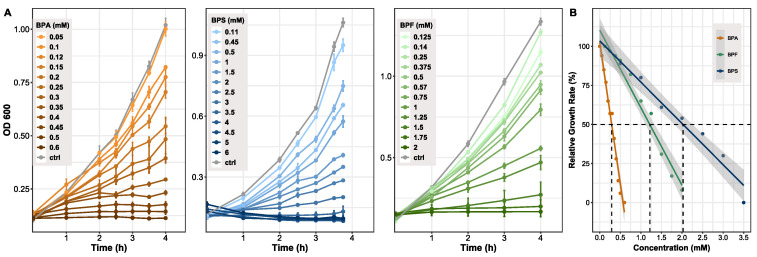
Figure 1.
Growth of Bacteroides thetaiotaomicron exposed to BPA, BPF, and BPS. (A) Growth curves resulting from cells treated with different concentration of bisphenols. OD was measured at 600 nm and cells harvested in late exponential phase (n = 3). (B) Growth inhibition shown by relative growth rate (µrel). Growth at 0 mM (control) was set to 100%. A linear fit was applied to determine the half maximal effective concentration (EC50) for each bisphenol. Grey area indicating 95% confidence interval. Adj. R2 = 0.97. EC50 values: BPA: 0.3 mM, BPF: 1.2 mM, BPS: 2 mM.

