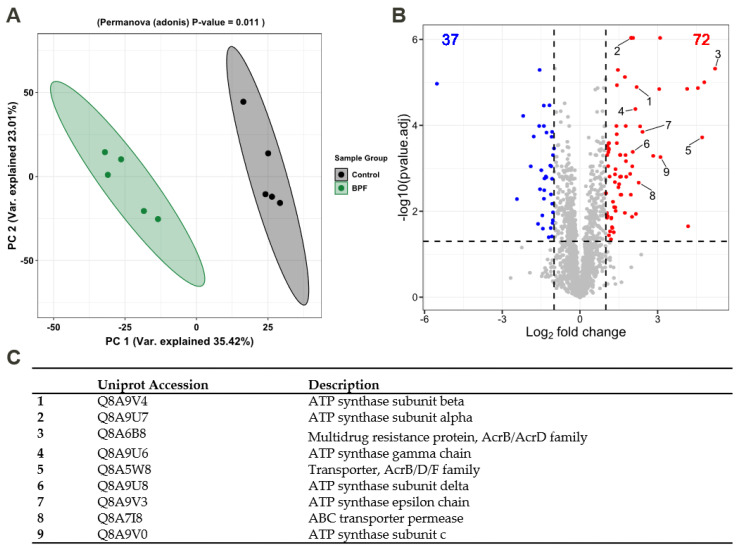
Figure 4.
Analysis of the proteome of B. thetaiotaomicron exposed to 0.57 mM BPF. (A) Principal component analysis based on protein abundances. PERMANOVA p-value of 0.01 highlights differences between BPF treatment and control. (B) Volcano plot shows differential abundant proteins (students t-test, adj. p-value < 0.05, Log2 fold change > 1). In total, 2050 proteins were detected, among which, 110 were differential abundant in BPF treated cells (decreased: 37 (blue), increased: 72 (red)). Highlighted proteins of interest (1–9) are listed in (C).

