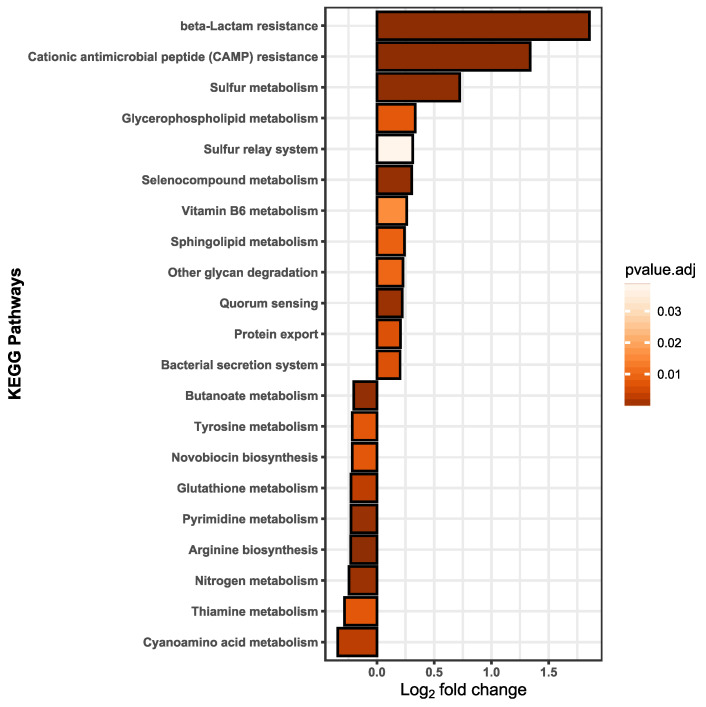
Figure 5.
Pathway analysis was based on the summed up protein abundance changes; the pathway function assignments were taken from the KEGG database. Twenty-one pathways were ascertained to be statistically different. A lower fold change indicates a less abundant pathway in BPF treated cells than in control and a fold change in the positive range reflects higher pathway abundance in BPF treated cells than in controls. Statistical analysis was performed in RStudio using multiple t-tests. Results were considered statistically different with a p-value adjusted (BH) < 0.05 and an absolute log2 fold change > 0.2. n = 5.

