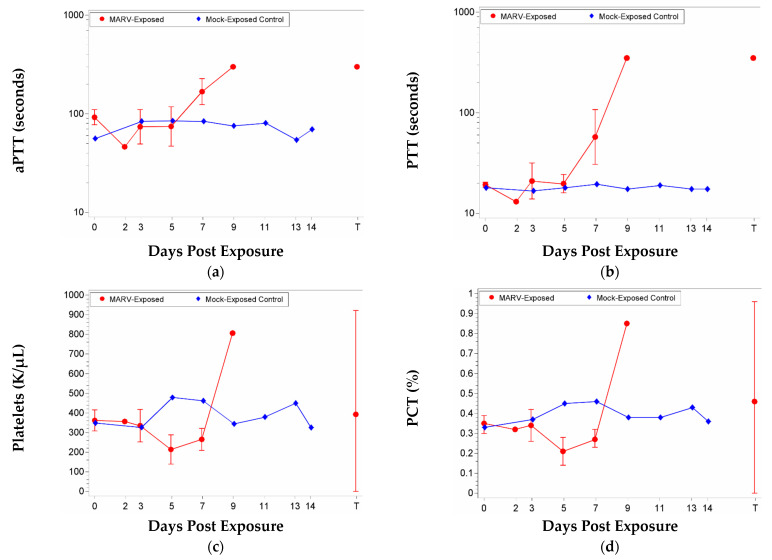
Figure 6.
Mean with 95 percent confidence intervals over the course of the study for coagulation. Confidence interval was not plotted for sample size less than 3. For aPTT and PTT, values were log-transformed, and the geometric mean is displayed. For platelets and plateletcrit, values were not log-transformed, and the arithmetic mean is displayed. Terminal (T)—Terminal data collected from animals that met euthanasia criteria (unscheduled euthanasia) were combined and reported as a single time point. (a) aPTT; (b) PTT; (c) Platelets; (d) Plateletcrit.

