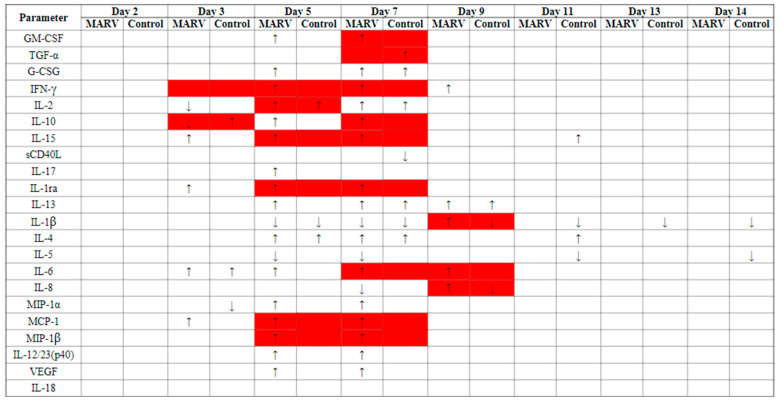
Figure 7.
Cytokine and chemokine changes from baseline throughout study for MARV-exposed versus mock-exposed group. Arrows (↑, ↓) indicate that the mean on the study day was significantly greater (“↑”) or less (“↓”) than that at the baseline (Day 0) at the 0.05 level. Red shaded cells indicate that the change from baseline for the MARV-exposed group was significantly different to that of the mock-exposed control group at the 0.05 level. For days 11, 12, and 14, only samples from mock-exposed animals were available.

