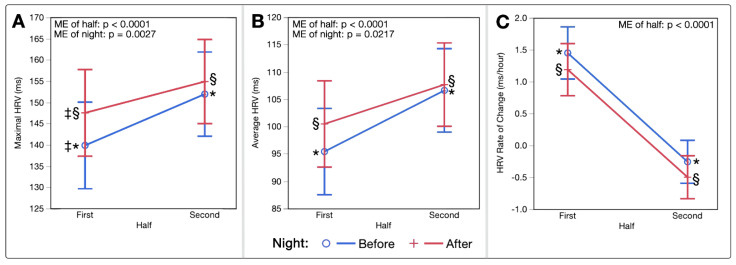
Figure 3.
(A–C) Heart Rate Variability Trends by Half of Night. Least squares means interaction plots demonstrating the effects of night half (first and second halves of each sleep period) and night (before or after PBMT intervention) on (A) Maximum HRV (ms). (B) Average HRV (ms). (C) Average rate of change in HRV per hour (ms/hour). (*) denotes significant pairwise differences between the first and second halves of the night before the PBMT intervention, (§) denotes significant pairwise differences between first and second halves of the night after the PBMT intervention, and (‡) denotes significant pairwise differences between the night before and night after PBMT intervention during the first half of the night only. (HRV, heart rate variability; ME, main effect; ms, milliseconds).

