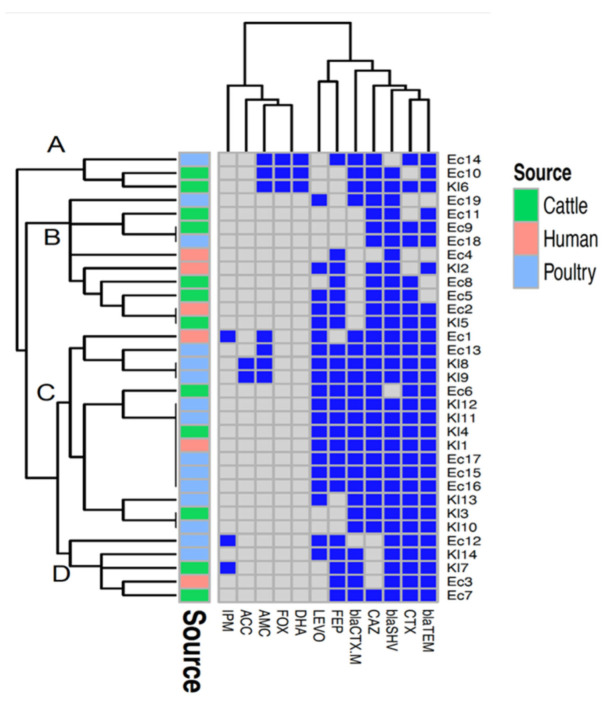
Figure 1.
A heatmap supported by a dendrogram showing the distribution of the antimicrobial resistance genes and resistance phenotypes among the examined Escherichia coli and Klebsiella isolates from humans, cattle, and poultry. Dark blue squares indicate resistance genes and phenotypic resistance; gray squares indicate absent genes and phenotypic susceptibility. Four clusters (A–D) are indicated in the figure.

