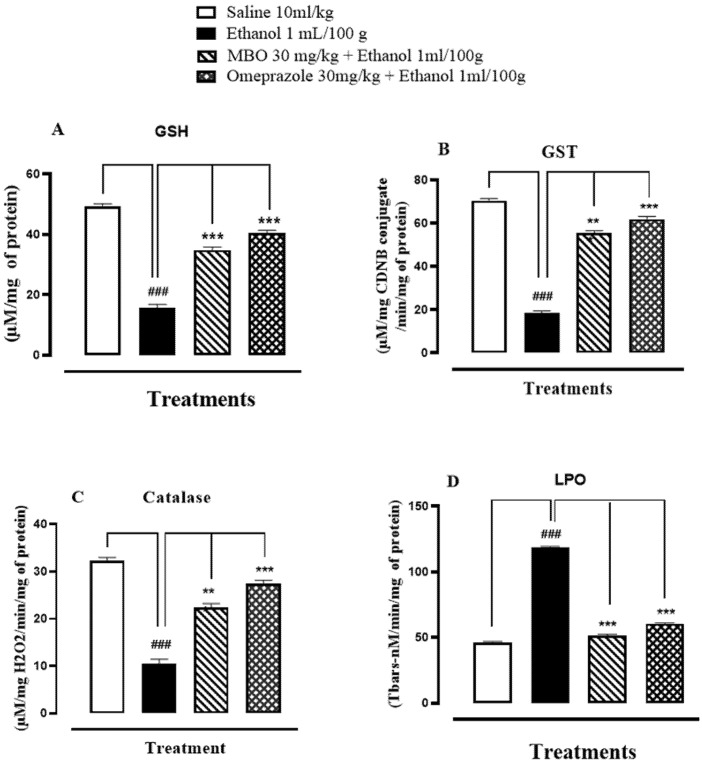
Figure 3.
(A–D) Bar graph representing the effect of MBO and omeprazole against reduced glutathione (GSH), glutathione-s-transferase (GST), catalase and lipid peroxidation (LPO) in ethanol-induced gastric ulcer tissues. Values expressed as mean ± SEM (n = 3). One-way ANOVA, with posthoc Tukey’s test. ### p < 0.001 vs. saline group, *** p < 0.001 vs. ethanol groups.

