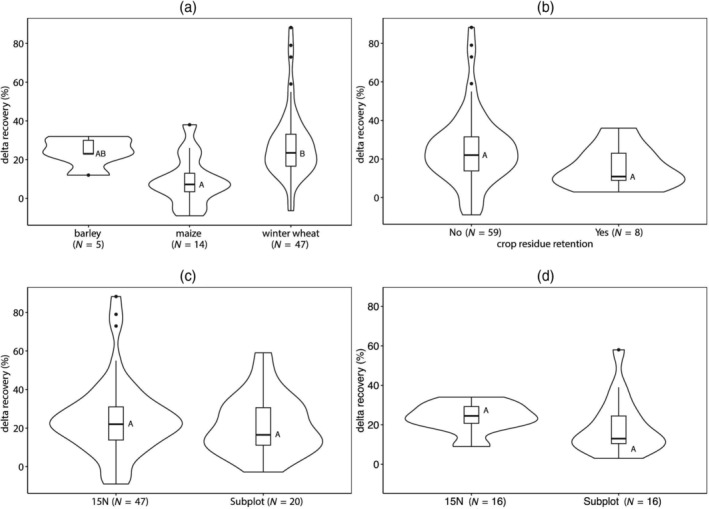
FIGURE 5.

Violin plots of the distribution of ∆RE, separated for (a) crop types, (b) crop residue retention (no N = 59, yes N = 8), and (c,d) method; within each violin plot, a boxplot indicates the median, lower (1st) and upper (3rd) quantile of the data. Plot (c) illustrates the distribution of all data points (15N N = 47, subplot N = 20). Plot (d) contains only data from an experiment, which allowed for both 15N and the Subplot method (N = 16). If upper case letters near the median are identical then there is no significant difference
