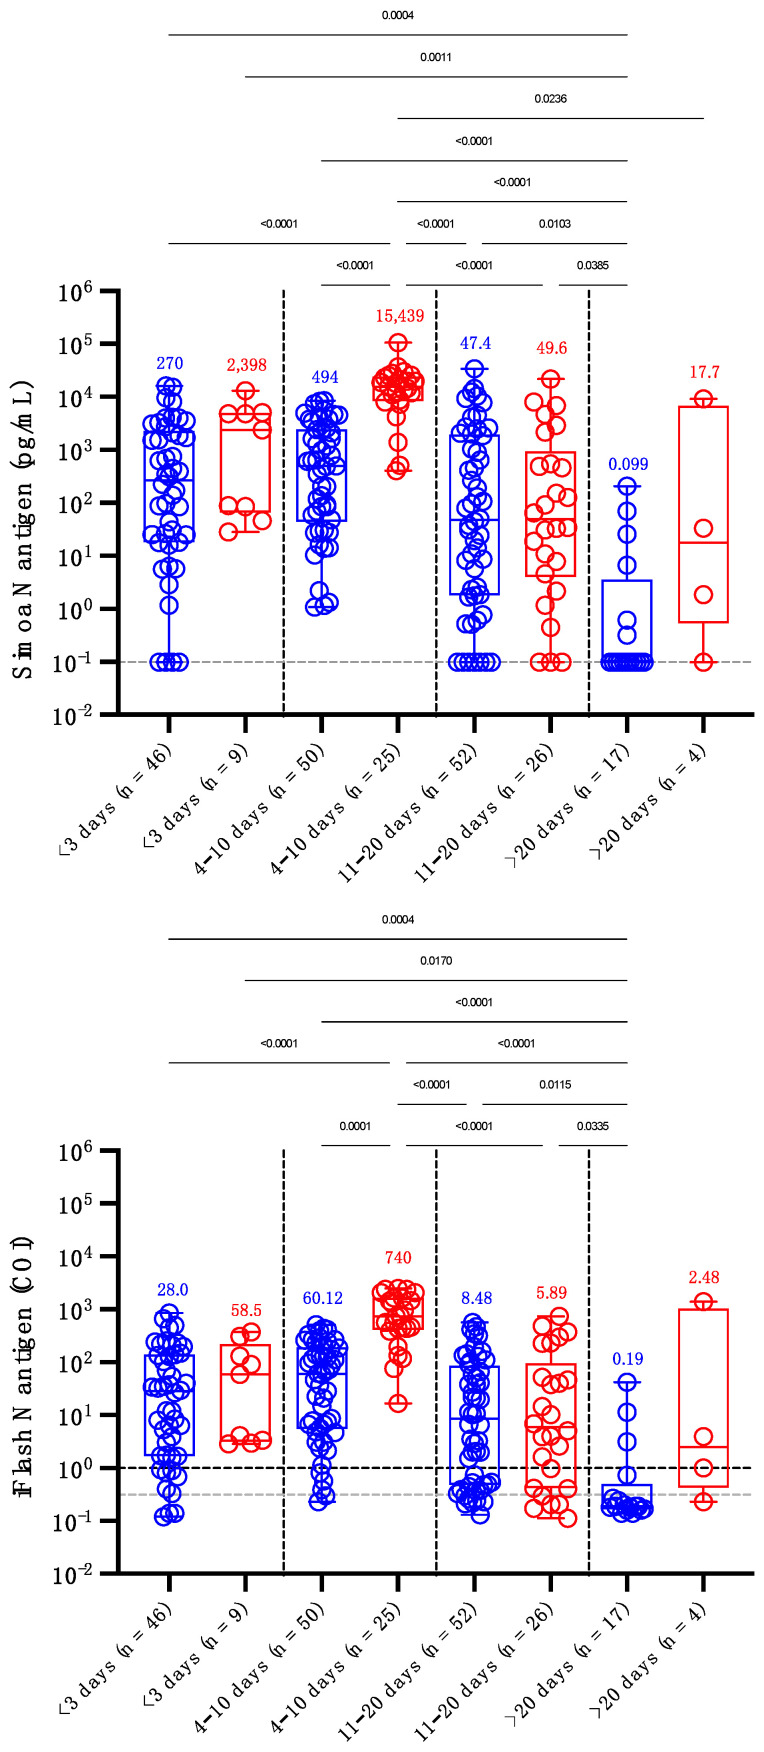
Figure 3.
Levels of serum antigen according to the delay since the onset of symptoms (<3, 4–10, 11–20 and >20 days) and severity. Blue dots correspond to non-severe patients and red dots to severe patients. The grey dotted lines correspond to the positivity cut-off of each antigen assay, as found by ROC curve analyses. The black dotted line corresponds to the positivity cut-off of the iFlash assay, as declared by the manufacturer. Medians are represented on top of each whisker box. Only p-values < 0.05 are represented.

