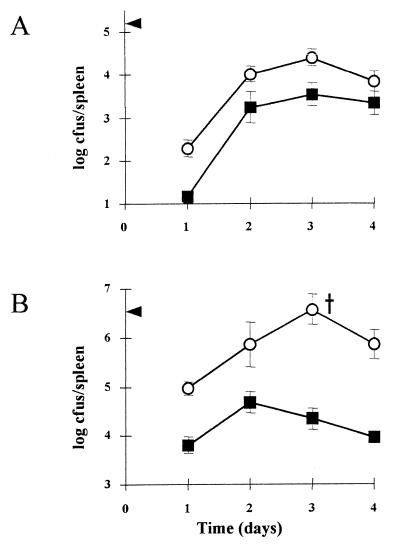
FIG. 3.
Growth of LO28 (○) and LO28ΔlisK (■) in the spleens of BALB/c mice. Mice were inoculated with 1 × 10⁵ (A) and 2 × 10⁶ (B) Listeria cells by the intraperitoneal route. The arrowheads indicate the numbers inoculated into the peritoneal cavity on day 0. The cross indicates that one mouse died at that time point. Each datum point represents the mean log10 number of Listeria cells per spleen for four mice. Error bars represent the standard deviations of triplicate experiments. (A) Differences were significant on days 1 and 3 (0.1 < P < 0.5). (B) Differences were significant on days 1, 3, and 4 (0.01 < P < 0.02). In all cases, significance was calculated by using the Student t test.

