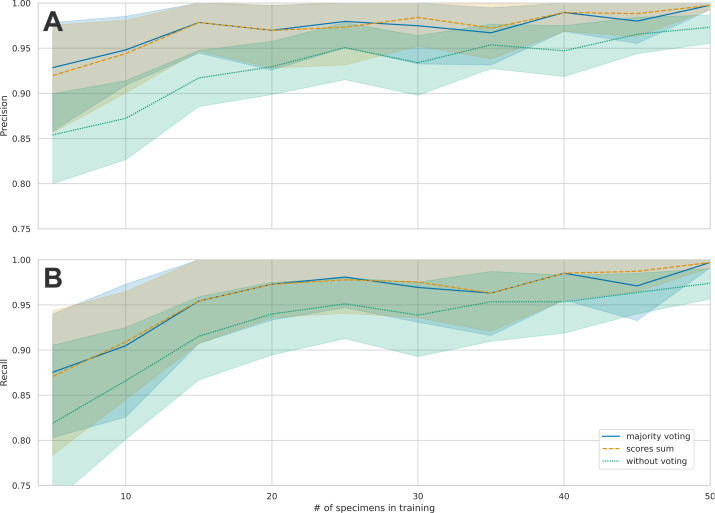
Figure 3. Comparison of the mean precision and recall across species for the three different principles of classification.
Individual images, majority vote and scores sum. (A) shows the average precisions across the 16 taxa and the 95% confidence intervals. When increasing the number of training samples, the precision also increases. B: This figure shows the average recall across the 16 taxa and the 95% confidence intervals. When increasing the number of training samples, the recall also increases.

