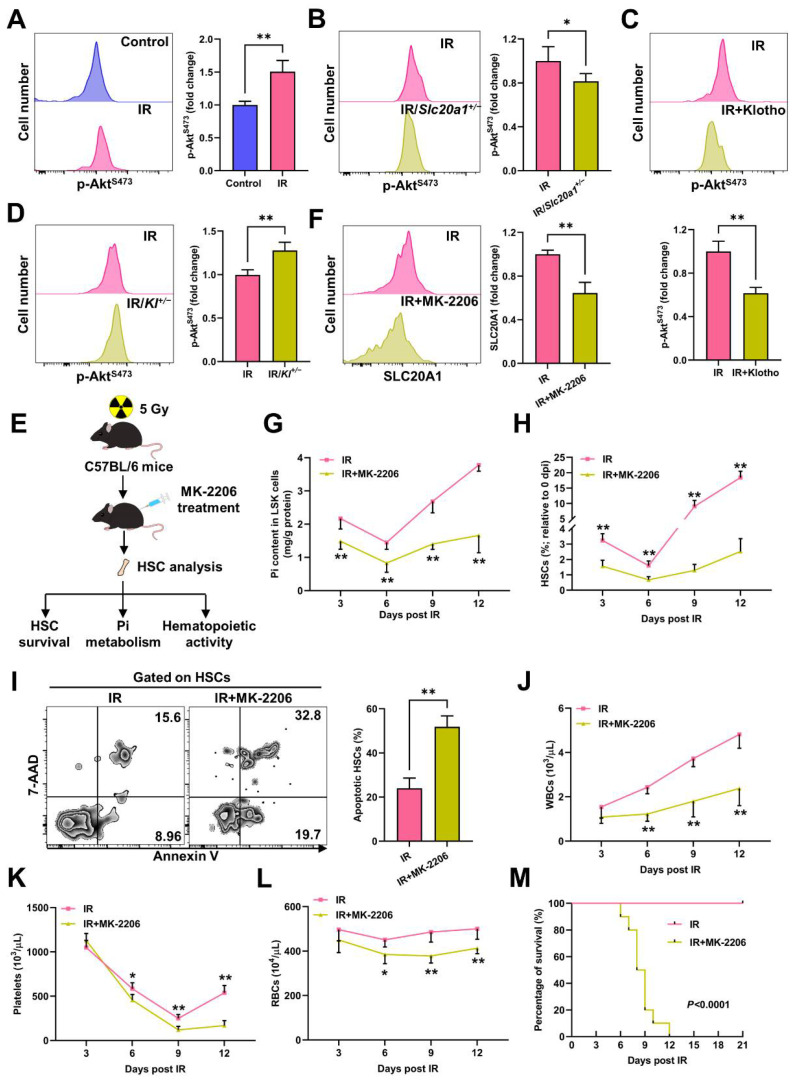
Figure 5.
Akt counteracts Pi metabolic inhibition and apoptosis of HSCs post IR. (A) Representative flow cytometric analysis and fold change of p-AktS473 MFI in BM HSCs of mice at 3 dpi (n = 5). (B) Representative flow cytometric analysis and fold change of p-AktS473 MFI in BM HSCs of WT mice and Slc20a1+/− mice at 3 dpi (n = 5). (C) Representative flow cytometric analysis and fold change of p-AktS473 MFI in BM HSCs of mice with or without Klotho treatment at 3 dpi (n = 5). (D) Representative flow cytometric analysis and fold change of p-AktS473 MFI in BM HSCs of WT and Kl+/− mice at 3 dpi (n = 5). (E) Scheme for MK-2206 treatment and HSC analysis. (F) Representative flow cytometric analysis and fold change of SLC20A1 MFI in BM HSCs of mice with or without soluble MK-2206 treatment at 3 dpi (n = 5). (G) Pi content in BM LSK cells of mice with or without MK-2206 treatment post IR (n = 6). (H) Relative HSC numbers in the BM of mice with or without MK-2206 treatment post IR compared to those at 0 dpi. (n = 6). (I) Representative flow cytometric analysis and quantification of apoptotic HSCs in the BM of mice with or without MK-2206 treatment at 3 dpi (n = 6). (J–L) WBC, RBC, and platelet counts in PB of mice with or without MK-2206 treatment post IR (n = 6). (M) Survival rates of mice with or without MK-2206 treatment post IR (n = 10). Data are mean ± SD. * p < 0.05, ** p < 0.01. Two-tailed unpaired Student’s t-test. (M) Log-rank test.

