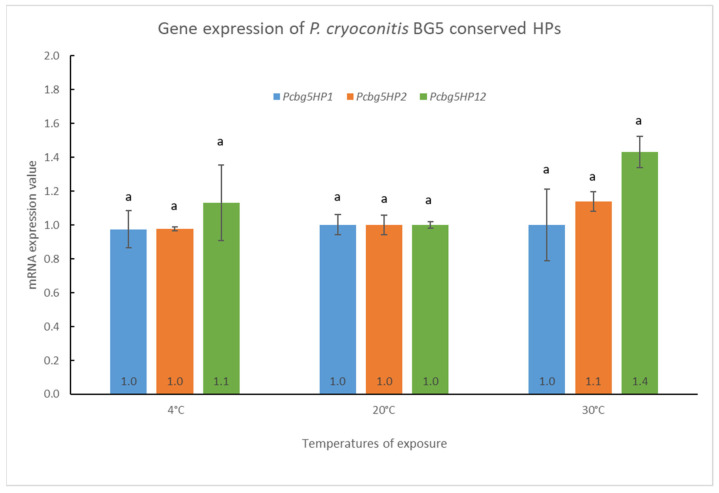
Figure 5.
Gene expression analysis of pcbg5hp1, pcbg5hp2, and pcbg5hp12. Data were representative of three biological replicates and were expressed as the mean ± SD. The letter above columns indicated levels of different significance, p > 0.05. The level of mRNA expression was measured in cells cultured at the indicated growth temperature for 6 h and normalized against 16S rRNA gene (internal control) levels. The mRNA expression value at 20 °C was set to 1 and the other values were normalized against this.

