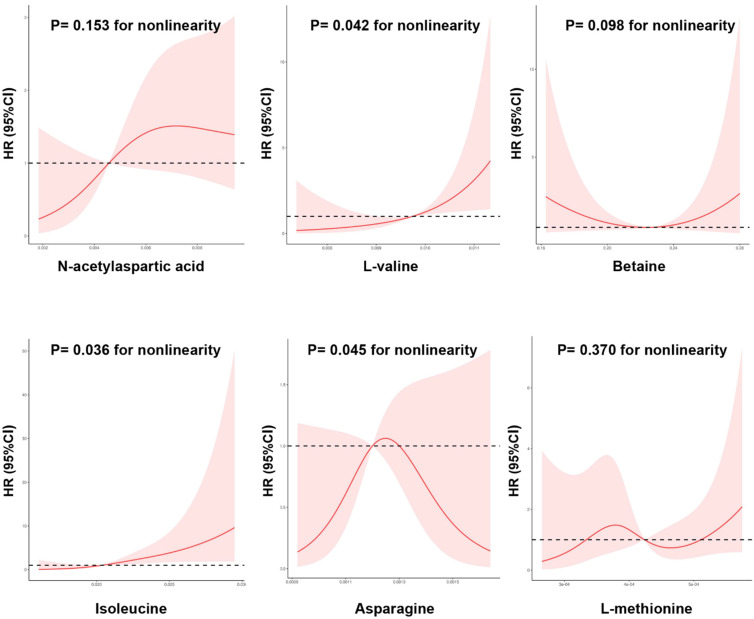
Figure 5.
The nonlinear dose-dependent relationship between metabolic alterations and risk of new-onset diabetic kidney disease. Restricted cubic spline curve was carried out with 4 knots of baseline metabolic index. The solid line represents the association of metabolic index with DKD risk, and the shaded portion represents 95% CI estimation.

