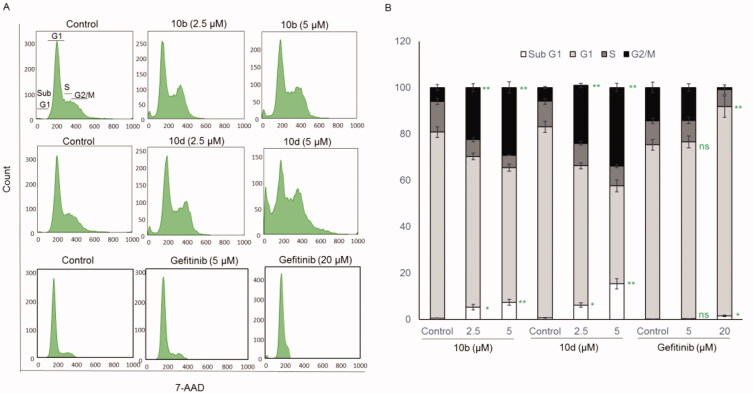
Figure 6.
Compounds 10b and 10d arrested the cell cycle at a G2/M phase while gefitinib arrested the cell cycle at a G1 phase in A549 cells. (A) Representative cell cycle distribution data are shown by flow cytometric analysis upon incubation with 0 (control), 2.5 or 5 μM of 10b or 10d or with 0 (control), 5 or 20 μM of gefitinib for 24 h. (B) Quantification of cell cycle distribution upon 24 h incubation with 10b or 10d. The values are means ± SEM of three different experiments. *p < 0.05 and **p < 0.01 indicate significant differences compared with control. ns = non-significant.

