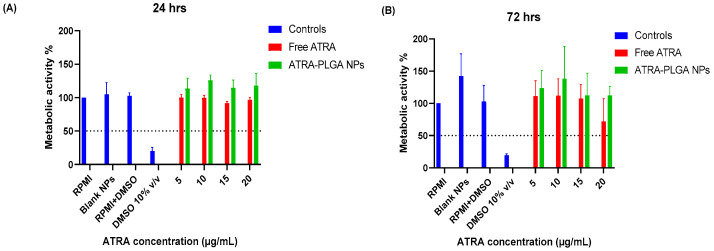
Figure 6.
ATRA treatment effect on cell viability as determined by MTS assay. MTS assay was performed at (A) 24 and (B) 72 h in the absence of H37Ra, and post-treatment of THP-1 cells with ATRA solution in DMSO and ATRA-PLGA NPs (5, 10, 15, 20 µg/mL of ATRA). RPMI and DMSO 10% v/v groups were utilized as the negative and positive controls, respectively. Results were plotted as (%) metabolic activity relative to RPMI group. Data shown as mean ± SD (n = 3). Statistical analysis was conducted using two-way ANOVA with Tukey’s post-hoc test.

