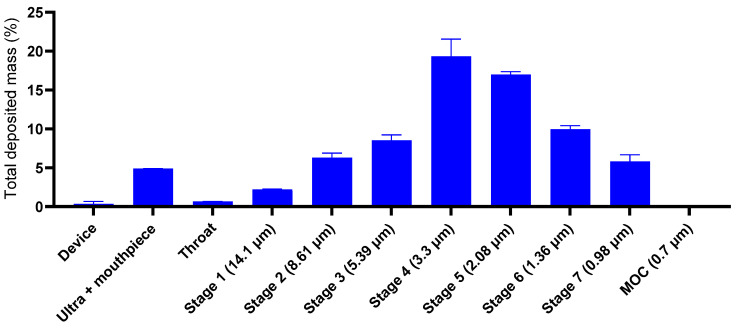
Figure 9.
Quantification of the deposited ATRA-PLGA NPs. Mass distribution of nebulized nanoparticles using cascade impactor at 15 LPM (W7, Westech, UK). The mass of drug substance collected on each of the components was eluted with 5 mL of methanol and quantified using a UV-Vis spectrophotometer at 348 nm. Results are shown as the % total drug deposited on all stages of the impactor including the throat. The data are represented as nominal dose mass percentage. Data are shown as mean ± SD (n = 3).

