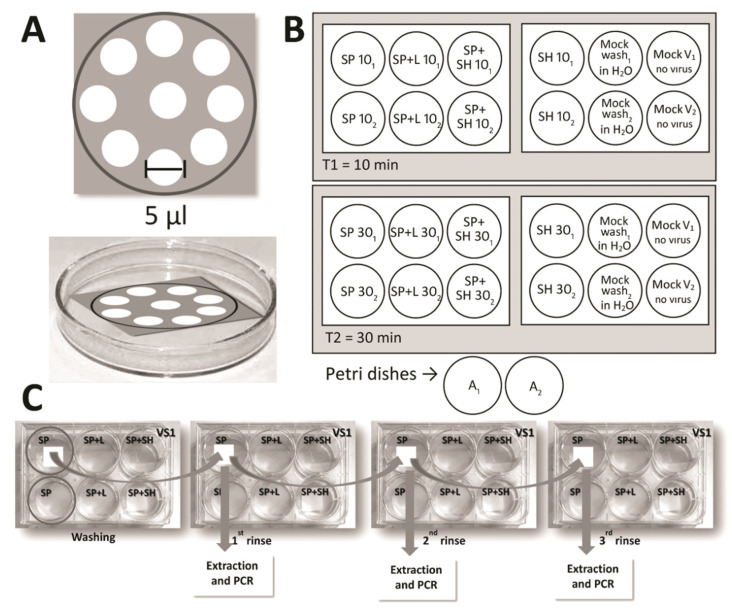
Figure 6.
Schematic representation of the inoculations and washes. (A) To simulate contamination, 50 μL of the viral suspensions were distributed on the masks in 5 μL droplets. (B) Distribution of the different types of washes on the plates as per the viral suspension. (C) The rinsing and sample collection process for RNA extraction and Quantitative Reverse Transcription Polymerase Chain Reaction (RT-qPCR).

