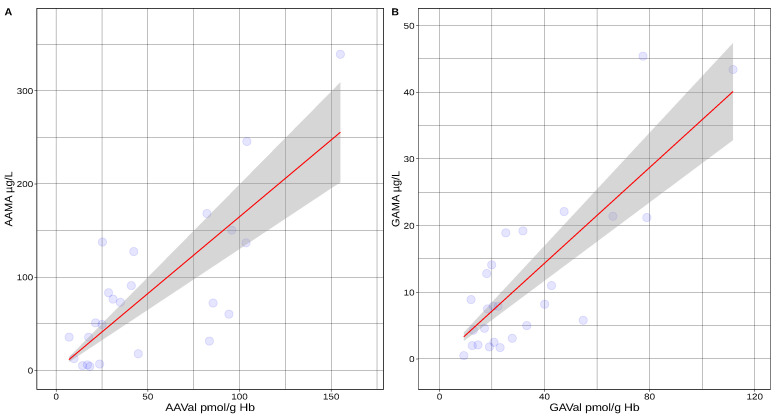
Figure 3.
Linear model of corresponding acrylamide biomarkers in blood and urine matrix. Regression of AAMA vs. AAVal ((A), AAMA (µg/L) = 1.64 × AAVal, pmol/g Hb, p < 0.0001) and GAMA and GAVal ((B), GAMA (µg/L) = 0.35 × GaVal, pmol/g Hb, p < 0.0001) in individuals (data kindly provided by T. Schettgen, M.B. Boettcher, J. Angerer). Red = regression line, blue = data points, grey = 95% confidence interval.

