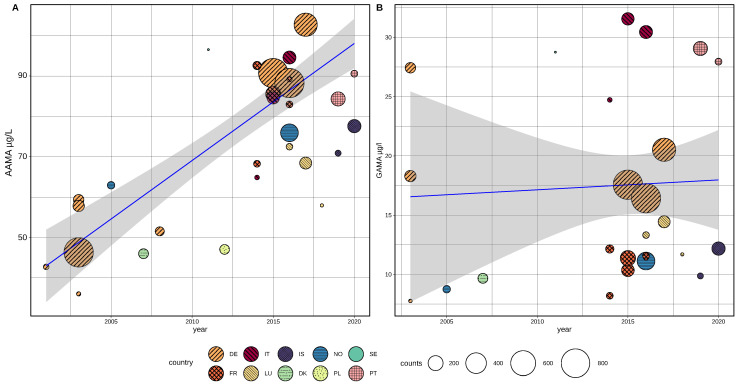
Figure 4.
Linear model (regression) of harmonized means of acrylamide biomarkers AAMA and GAMA (non-smokers) as reported by European published papers and HBM4EU Aligned Studies (AAMA 30 studies, GAMA 29 studies). Regional distribution is indicated by colors and relative population size is shown by the size of the circles indicating single surveys. (A): AAMA in µg/L, (B): GAMA in µg/L. Gray: 95%-confidence interval. Regression line in blue.

