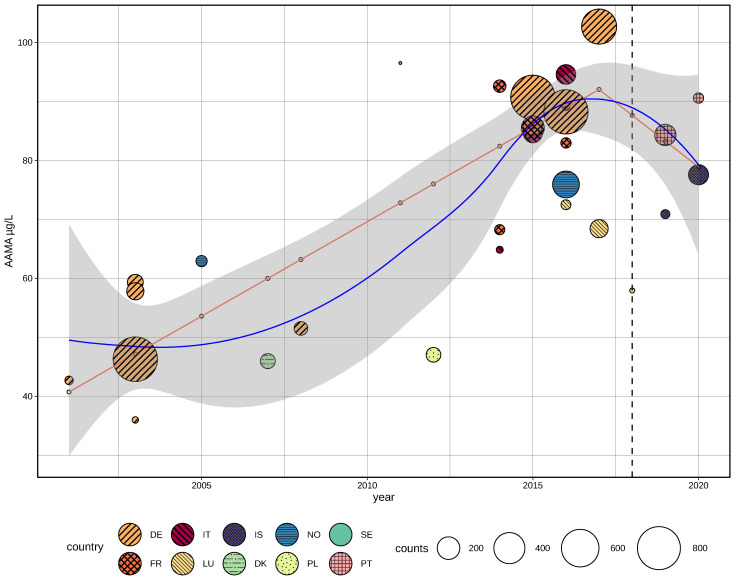
Figure 5.
Locally fitted scatter-plot fit (LOESS) for AAMA time-trend data (harmonized, non-smokers). Study means represented by country color-coded dots with size dependent on count number and 95%-confidence interval (gray). LOESS fit line in blue. The red line shows the trend of a multi-segmented regression analysis (significant break-point detected in 2017, p < 0.001). Dashed line indicating the time-point of Commission Regulation 2017/2158 put in force (2018).

