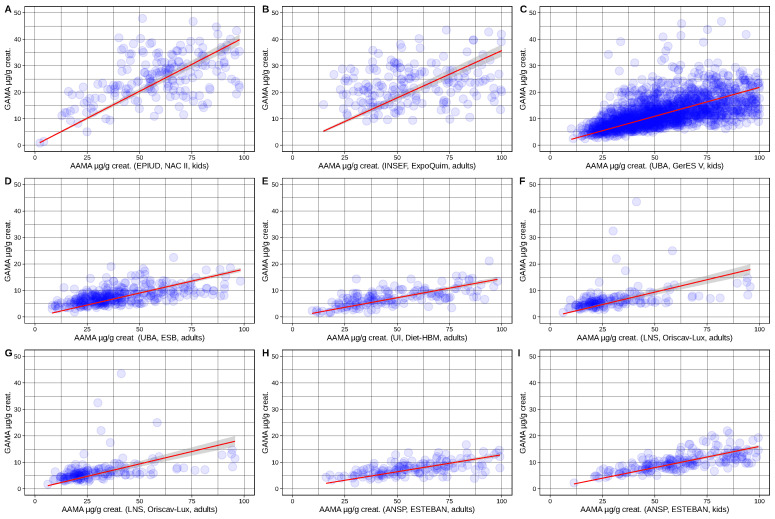
Figure A1.
Plots of AAMA vs. GAMA (in µg/L), in 9 different European populations ((A–I), individual data) as indicated. Linear fit in red, gray = 95%. AAMA to GAMA correlation is linear within the range of observations and the slope is depending on region/country, but not age, as indicated by data from France based on kids and adults (H,I). Higher GAMA-to-AAMA level ratio is reported from Italy (EPIUD, (A)) and Porugal (INSEF, (B)), low ratio from France (H,I).

