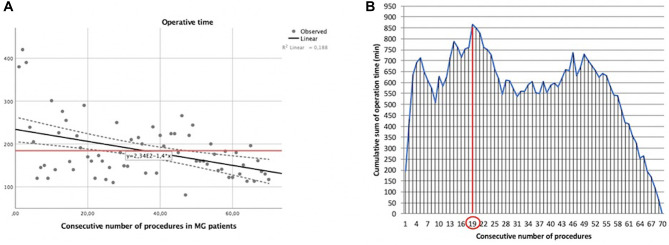
Figure 3.
Learning curve of robot-assisted myasthenic thymectomies. (A) Correlation between the operation time and the consecutive number of procedures [the red line represents the average time; the Pearson correlation coefficient (r) of linear function is −0.433]; (B) cumulative sum (CUSUM) plot for the overall surgical time. The red circle is the CLC cut-off value on the plot of CUSUM analysis. CLC, completion of learning curve.

