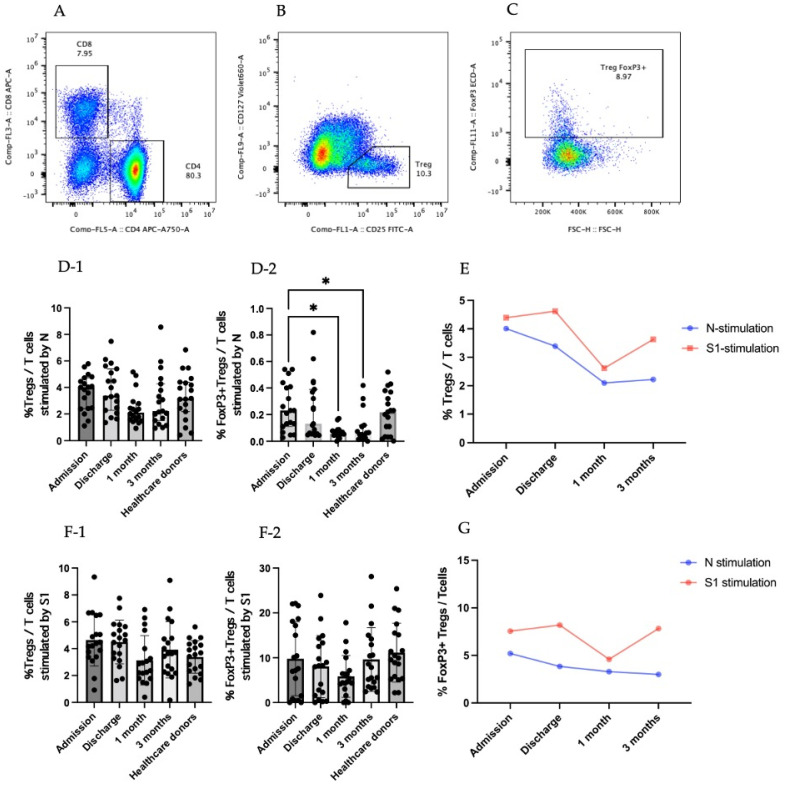
Figure 1.
Treg responses in SARS-CoV-2-infected patients. (A–C) are gating strategies for selecting regulatory T-cell population. (A) CD4+ area was gated to further identify Treg cells. (B) CD4+ T cells were identified by CD25+CD127low to be a Treg population. (C) Tregs were added by transcriptional factor FoxP3. (D) Results for stimulation by N peptide of SARS-CoV-2. (D-1) Percentage of Tregs in T-cell population. (D-2) Percentage of FoxP3+Tregs in T-cell population. (E) Percentage of Tregs in T-cell population in the form of kinetic change. (F) Results of stimulation by S1 peptide of SARS-CoV-2. (F-1) Percentage of Tregs in T-cell population. (F-2) Percentage of FoxP3+ Tregs in T-cell population. (G) Percentage of FoxP3+Tregs in T-cell population in the form of kinetic change. (D-1,D-2,F-1,F-2) The results are presented as median with 95% confidence interval (CI). Statistical significance of differences between groups was determined using the Kruskal–Wallis test followed by Dunn’s multiple-comparison test, * p ≤ 0.05.

