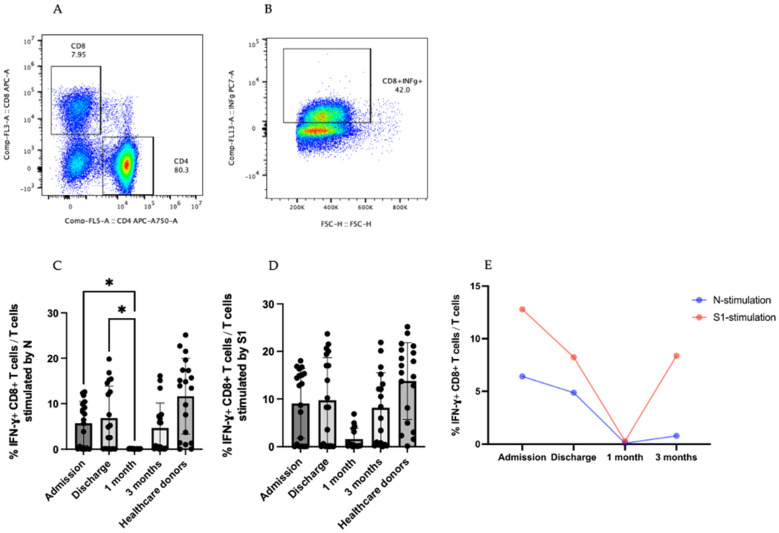
Figure 4.
IFN-γ + T-cell responses in COVID-19 patients. (A,B) are the steps of the gating strategy of IFNγ+CD8+ T cells (B). (C,D) are the percentage of IFN-γ +CD8+ T cells in T-cell population stimulated by SARS-CoV-2 N and S1 peptides. (E) Percentage of IFN-γ+ CD8+ T cells in T-cell population in the form of kinetic change. The results are presented as median with 95% CI. Statistical significance of differences between groups was determined using the Kruskal–Wallis test followed by Dunn’s multiple-comparison test, * p ≤ 0.05.

