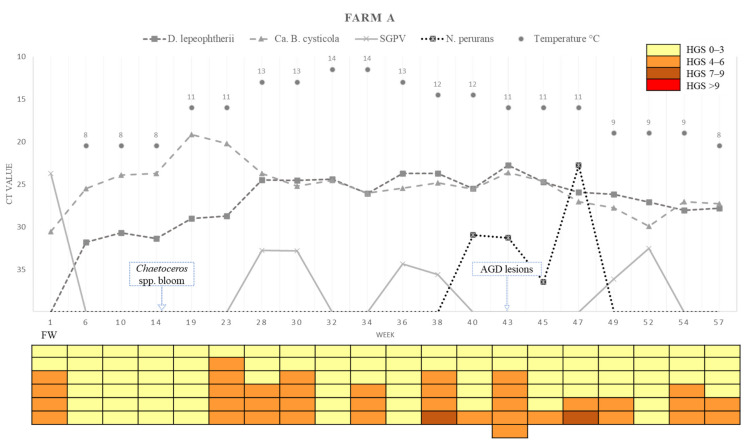
Figure 7.
Variations in pathogen Ct values, epidemiology, histological gill score (HGS) and water temperatures in each sampling week of Farm A. Cells in the colour-coded matrix represent HGS results of individual sampled fish. FW = Freshwater; Week 1 is sampling point before transfer to Farm A. AGD = amoebic gill disease; H2O2 = hydrogen peroxide.

