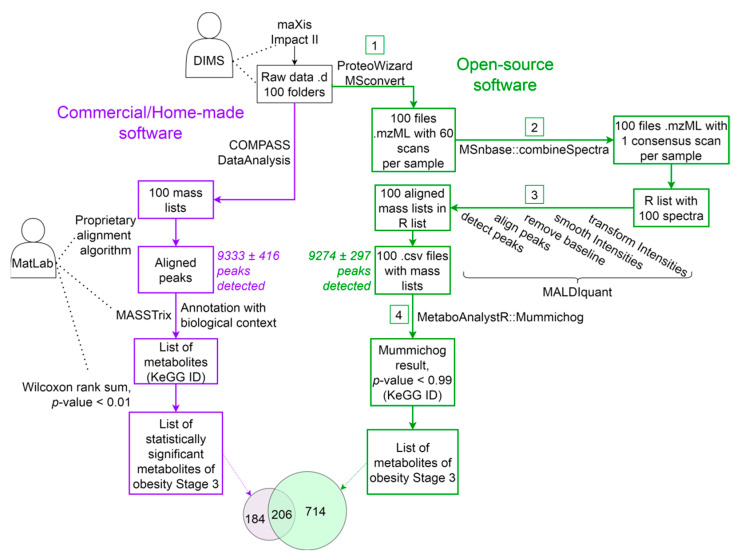
Figure 1.
The order of launching programs for processing DIMS (ESI-QTOF, maXis Impact II, Bruker Daltonics) mass spectra. On the left (purple), a pipeline with the commercial COMPASS DataAnalysis program, and the MatLab development environment is shown. On the right (green)—the MALDIquant package together with MetaboAnalystR/Mummichog R language module. The numbers in the squares indicate the data processing steps described in the text.

