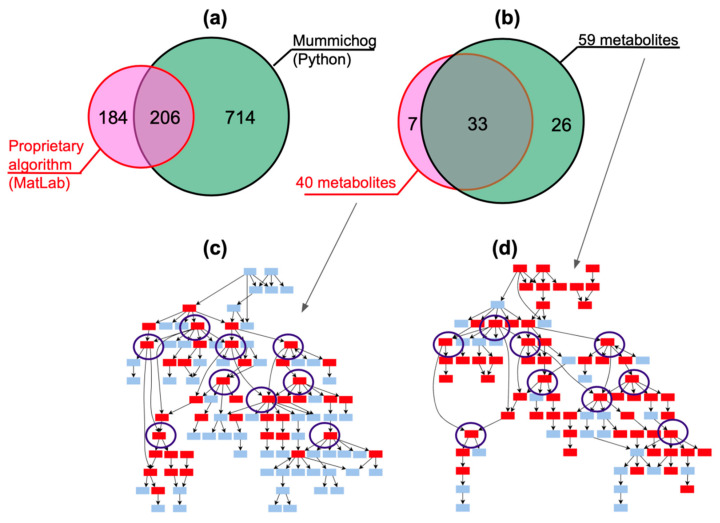
Figure 2.
(a) KEGG-annotated metabolites related to the third stage of obesity (20 samples). The pink circle denotes the set of metabolites defined by the biological context, implemented in the MatLab development environment, followed by the application of the Wilcoxon test (p-value < 0.01). The green circle represents the set of metabolites annotated with the Mummichog algorithm (MetaboAnalystR package). (b) Metabolites related to the synthesis of steroid hormones. The pink circle is the number of metabolites found by the algorithm based on the biological context (MatLab script), the green circle is the number of metabolites found by Mummichog. (c,d) Steroidogenesis pathways with the indication of annotated (red boxes) and non-annotated (blue boxes) metabolites. Outlined boxes with KeGG IDs are identical nodal metabolites found using two compared approaches.

