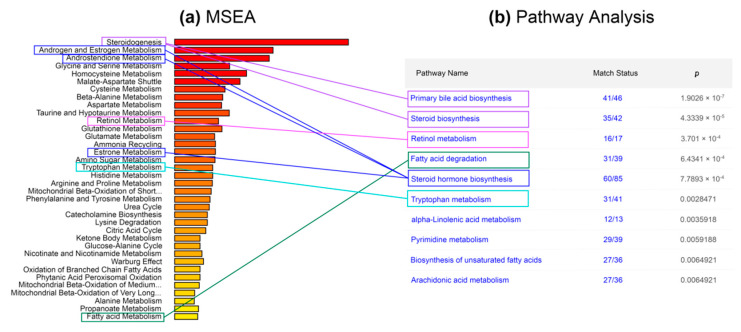
Figure 5.
Enriched metabolic pathways in the third stage of obesity, MetaboAnalyst 4.0/5.0, web-version. (a) DIMS mass-spectra after processing with the DataAnalysis/MatLab pipeline were analyzed by the MSEA tool. (b) DIMS mass-spectra after MALDIquant/Mummichog pipeline processing were analyzed with the Pathway Analysis tool. “Match Status” indicates the number of annotated metabolites/number of known metabolites of the KEGG pathway.

