Figure 7.
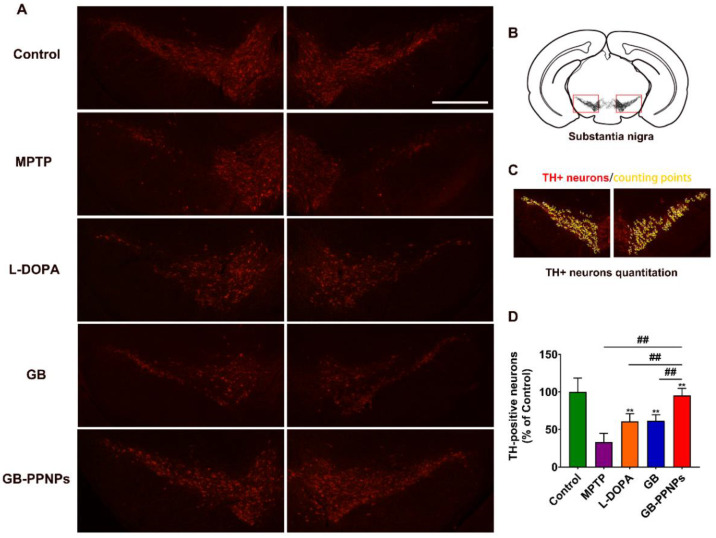
The in vivo neuroprotection of GB-PPNPs in MPTP-treated PD model mice. (A) Representative TH-stained murine brain sections. (B) Schematic illustration of the representative brain sections. Scale bar: 500 μm. (C) Quantification of TH+ neurons by manual counting with ImageJ software. (D) The number of TH+ neurons (both the right and the left substantia nigra) in the indicated treatments (n = 6). ** p < 0.01 with respect to MPTP. ## p < 0.01 with respect to GB-PPNPs.

