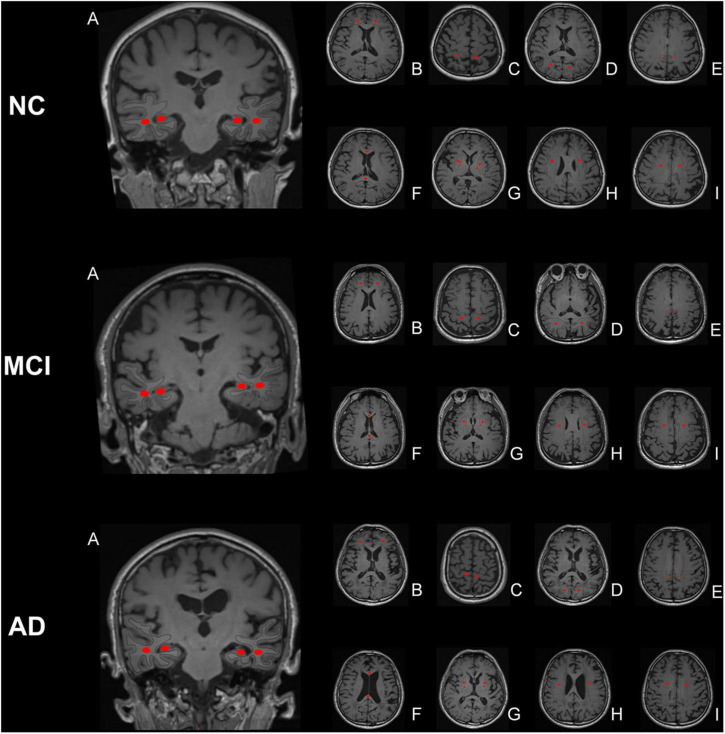
FIGURE 2.
Region of interest (ROI) placement diagram. The selected ROIs are shown on the T1 maps. (A) temporal lobe and hippocampus; (B) frontal lobe; (C) parietal lobe; (D) occipital lobe; (E) precuneus; (F) splenium of the corpus callosum and genu of the corpus callosum; (G) posterior limb of the internal capsule and lenticular nucleus; (H) corona radiata; (I) centrum semiovale. The central part of the largest layer and the upper and lower adjacent layers of the structure were selected, and the same sized ROIs were drawn in the symmetrical region of the bilateral lobes, avoiding the interference areas, such as the cerebrospinal fluid and blood vessels.

