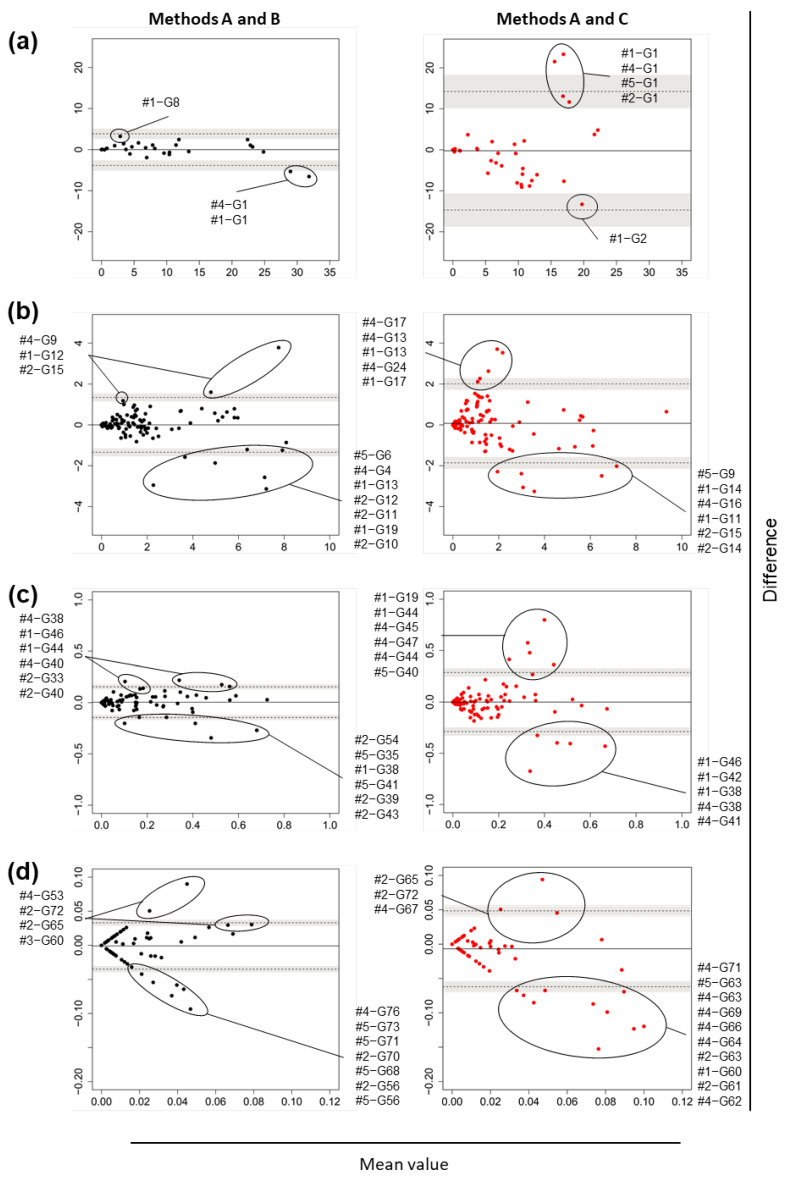
Figure 5.
Research I: Bland–Altman plots of the relative abundance of fecal bacteria at the genus level obtained by each method from five adult volunteers. Comparisons between Methods A–B (left) and Methods A–C (right). The relative abundance of bacteria in each specimen was plotted. (a) Their maximum abundance in any of the specimens was ≥10%; (b) ≥1% and <10%; (c) ≥0.1% and <1%; (d) <0.1%. Solid lines indicate the means of the differences between the two test values, dotted lines indicate the limits of agreement (the mean of the difference ± 1.96 × standard deviation), and the gray shaded area indicates the 95% confidence interval of the limits of agreement. For Methods A and B, stool samples were collected using commercial collection tubes. For Method C, urine and stool samples were applied to disposable diapers. For Methods B and C, the samples were stored at −80 °C for 2 months.

