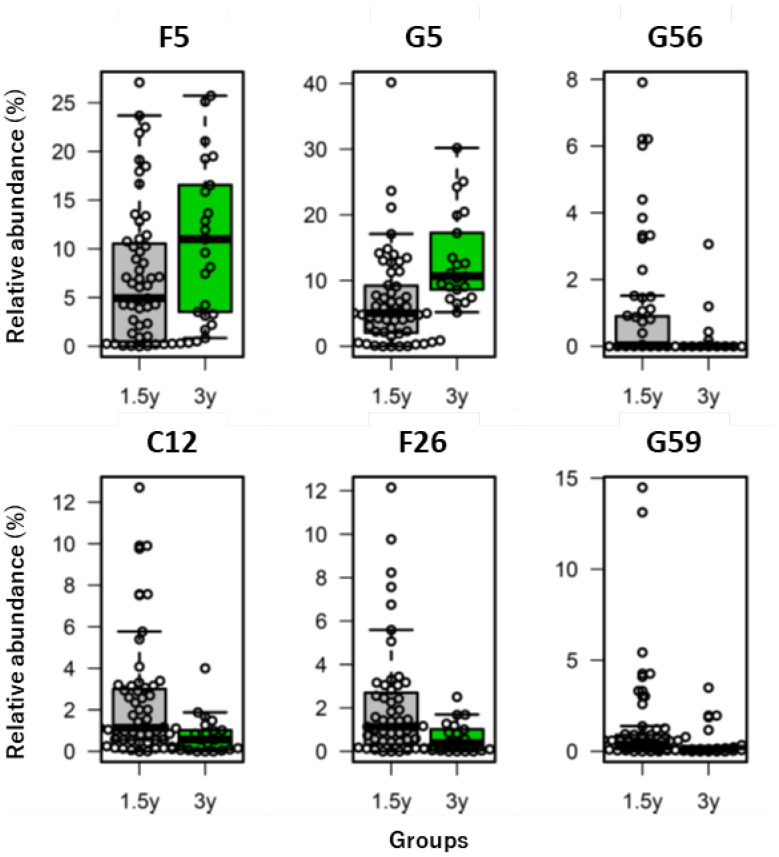
Figure 8.
Box plots of the bacteria listed in Table 5 that showed significant different relative abundances between the two age groups (1.5 years and 3 years). The depicted bacteria are those whose abundance differences between Methods A–C were within the limits of agreement in all the specimens (See Table 5). Bold lines in the middle of the box are the medians, the top of the box is the 3rd quartile, the bottom of the box is the 1st quartile, the upper whiskers are the largest data less than or equal to “3rd quartile + 1.5 × (3rd quartile − 1st quartile)” and the lower whiskers are the smallest data equal to “1st quartile − 1.5 × (3rd quartile − 1st quartile)”. See Tables S1–S6 for the bacterial taxonomy name corresponding to each ID.

