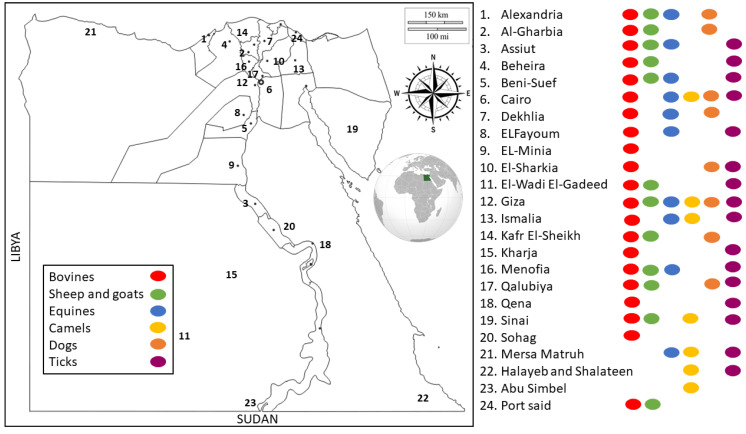
Figure 2.
Distribution of molecular studies on TBPs of animals in different locations of Egypt. Key numbers on the map represent the distributions of molecular studies across different locations. Key dots represent the distributions of molecular studies according to different hosts combined with the distributions across different locations in Egypt.

