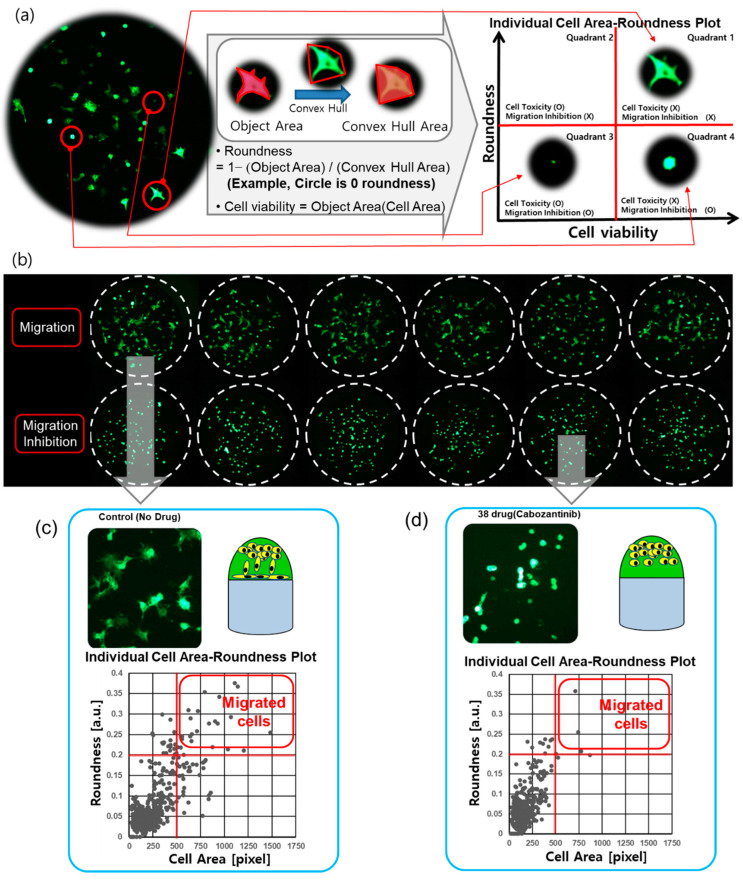
Figure 2.
Cell morphology analysis for the cell migration assay. (a) Cell image of a spot on a micropillar (no drug condition). Different morphology of cells was analyzed according to the roundness. The migrating and attached cells had a diffused shape, while the initial seed cells had a spherical shape. The cells showing high roundness and area were located in quadrant 1 of the cell area roundness plot. The high roundness mean cell has a diffused shape, therefore, there are no cells with high roundness and small cell area in quadrant 2. The area and roundness of the damaged cells were reduced, and those cells were located in quadrant 3 of the cell area-roundness plot. The drugs that inhibited migration without cell toxicity mainly reduced the roundness of cells; those cells were located in quadrant 4 of the cell-roundness plot. (b) Six replicated spot images at migration cells and migration inhibition cells. (c) Individual cell area-roundness plot under no drug condition. (d) Individual cell area-roundness plot for the cell migration inhibition drug (Cabozantinib).

