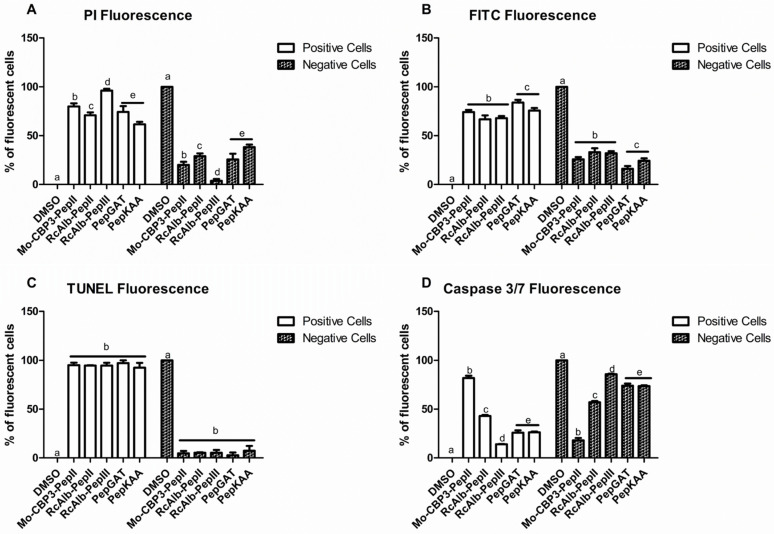
Figure 6.
The number of fluorescent C. neoformans cells PI (A), Dextran-FITC (B), DNA fragmentation (C), and apoptosis (D). The letters represent the mean ± standard deviation of three replicates. Different lowercase letters indicate statically significant difference compared to DMSO-NaCl by analysis of variance (p < 0.05). The concentration of peptides was 25, 0.04, 0.04, 0.04, and 0.04 μg mL−1, respectively, for Mo-CBP3-PepII, RcAlb-PepII, RcAlb-PepIII, PepGAT, and PepKAA.

