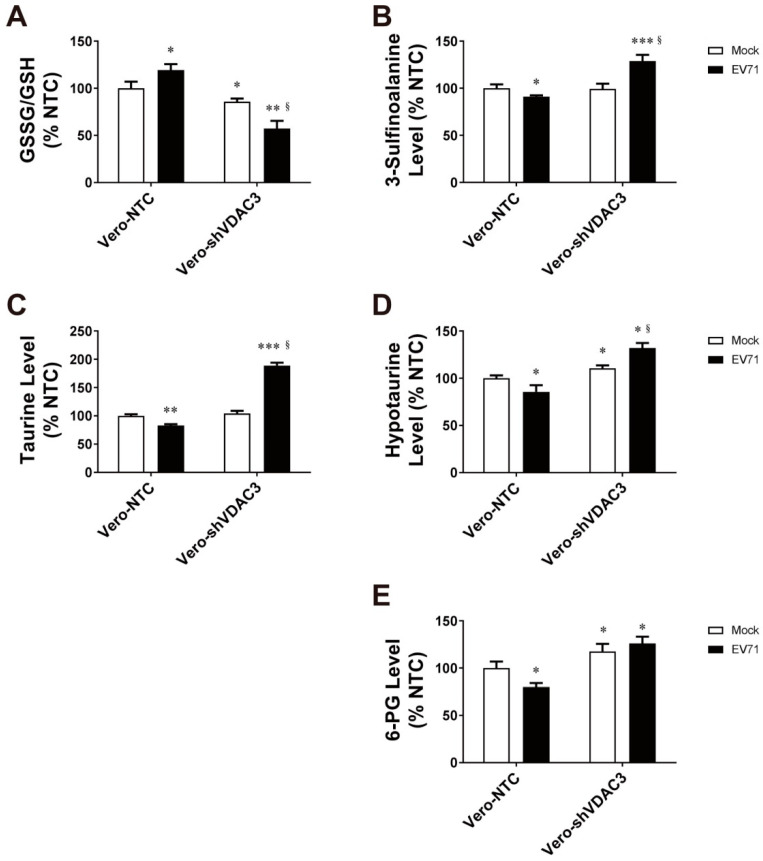
Figure 8.
Alterations in antioxidant metabolism in EV71-infected cells. Vero-NTC and Vero-shVDAC3 cells were mock infected (Mock) or infected (EV71) at an MOI of 1.25, and extracted at 16 h post-infection for metabolomic analysis with UPLC-Q-TOF-MS (n = 18). Their GSSG/GSH ratio (A) and intracellular levels of 3-sulfinoalanine (B), taurine (C), hypotaurine (D) and 6-PG (E) are shown. The GSSG/GSH ratio and the levels of metabolites are expressed as a percentage of those of the mock-infected Vero-NTC cells. Data are mean ± SD (n = 18). * p < 0.05, ** p < 0.01, *** p < 0.005, vs. mock-infected Vero-NTC cells; § p < 0.05 vs. infected Vero-NTC cells.

