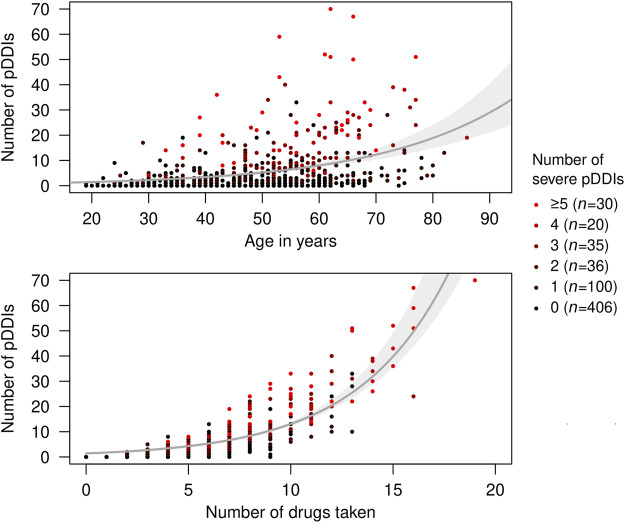
FIGURE 5.
Frequency of potential drug-drug interactions in relation to age and number of drugs taken. The patients (N = 627) took 5.3 medications on average. A subset of 441 patients had at least one pDDI according to at least one of the three databases used. Red dots in the scatterplot represent patients with multiple severe pDDIs. Fitted exponential curves with 95% bootstrap confidence intervals are shown in gray. pDDI, potential drug-drug interaction.

