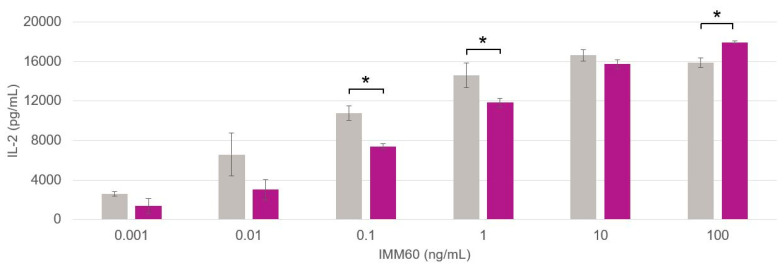
Figure 4.
Differences in IL-2 production by mouse iNKT cells with respect to the particle production method. Average data points are acquired from the curves of peptide 1, peptide 2 and peptide 3 responses pooled together. Data obtained from particles generated at the lab -scale and industrial scale are depicted in grey and purple, respectively. (*) Significant p < 0.05.

