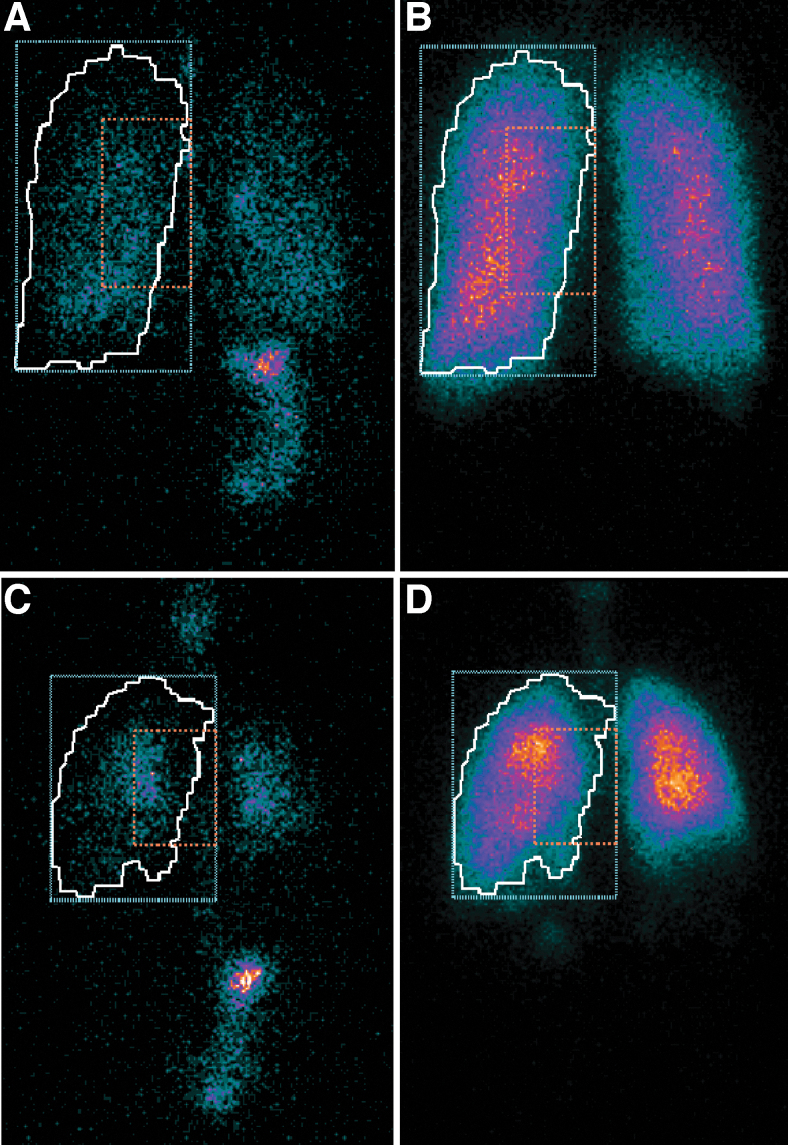
FIG. 1.
Example scans (reflected posterior views) from a healthy volunteer (A is lung deposition and B shows ventilation) and a patient with asthma (with C showing lung deposition and D showing ventilation). The white line is the ventilated lung margin derived from the krypton-81m gas ventilation image (autocontour drawn by the nuclear medicine software that detects the margins of the lungs as those pixels with ∼10% of the maximum pixel count). The blue dotted line indicates the peripheral lung ROI, and the orange dotted line indicates the central lung ROI. The central and peripheral ROIs used here correspond to the inner and outer ROIs described in Newman et al.(10) ROI, region of interest.

