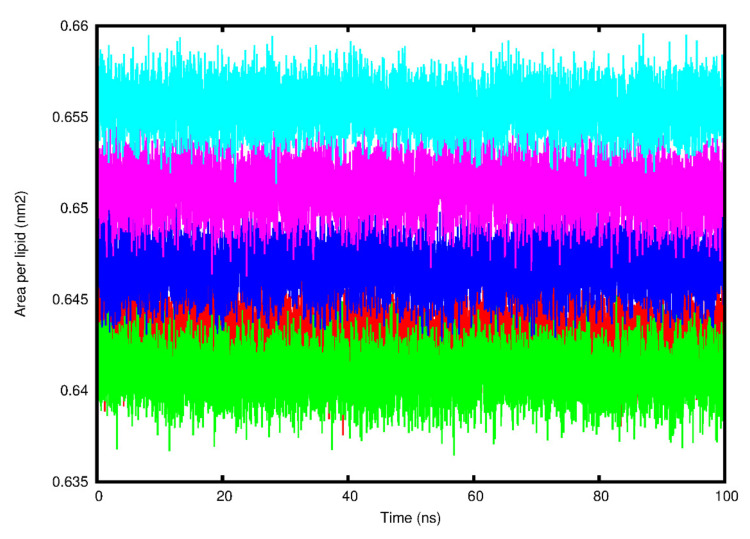
Figure 7.
The area per lipid (nm2) fluctuation of the simulated 1-palmitoyl-2-oleoylphosphatidylcholine (POPC) lipid bilayer over the 100 ns time scale for the five human (h) coronavirus (CoV) envelope (E) protein systems. Red: SARS-CoV-2 E protein, Green: SARS-CoV-1 E protein, Blue: HCoV-229E E protein, Pink: HCoV-NL63 E protein, Cyan: MERS-CoV E protein.

