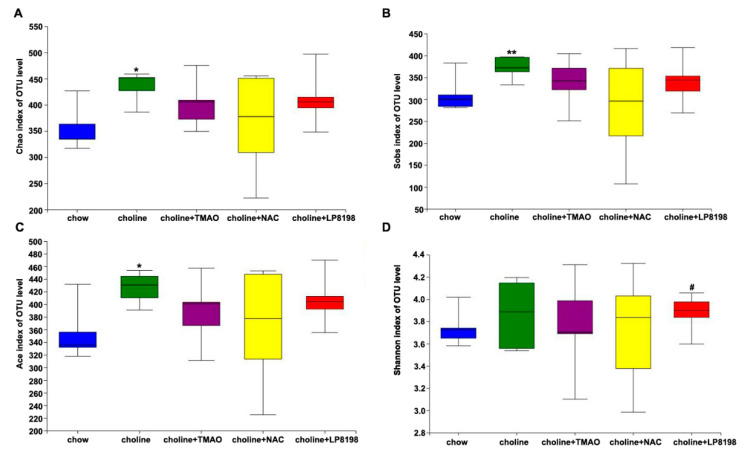
Figure 6.
Alpha diversity of bacterial communities. Estimation of bacterial richness (A–C) and diversity (D) is visualized using boxplots for chow (blue), choline (green), choline+TMAO (purple), choline+NAC (yellow) and choline+LP8198 (red) groups. The boxplots show the median, quartile, smallest and largest observations. n = 5 per group, the Wilcoxon rank-sum test was performed to determine statistical significance of alpha diversity analyses. * p < 0.05; ** p < 0.01, vs. the chow group. # p < 0.05, vs. the choline group.

