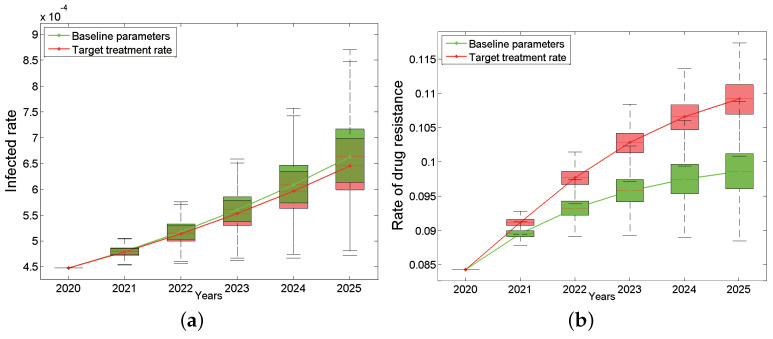
Figure 4.
Impact of target treatment rates on the HIV/AIDS epidemic: the infected rate (a) and the rate of drug resistance (b). The green box plots are based on the baseline parameters, while the red ones are based on target treatment rate. The continuous green and red curves are their median lines respectively.

