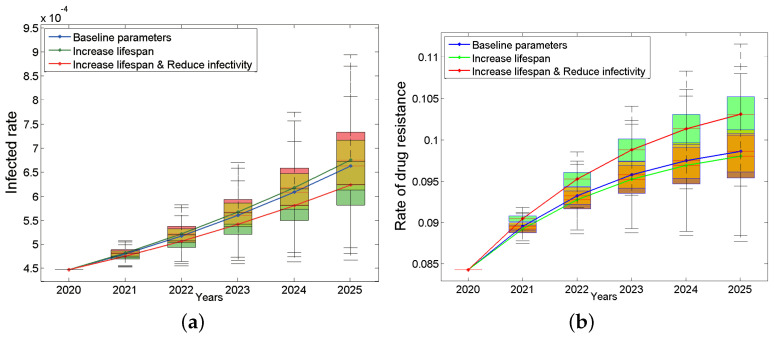
Figure 5.
Impacts of improving the treatment effect on the infected rate (a) and the rate of drug resistance (b). The blue box plots are based on the baseline parameters, the green ones are based on increase lifespan, and red ones are based on both increase lifespan and reduce infectivity. The continuous blue, green and red curves are their median lines respectively.

