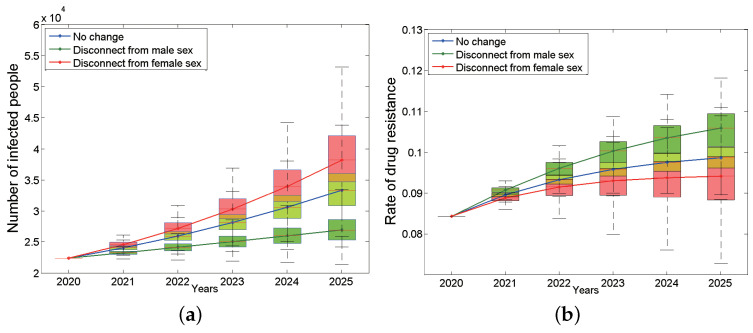
Figure A4.
The impact of changing the sexual preferences of bisexual men on the on the number of infected people (a) and the rate of drug resistance (b). The blue box plots are the situation of no change, the green ones are the situation that disconnect from male sex, and the red ones are the situation that disconnect from female sex. The continuous blue, green and red curves are their median lines respectively.

