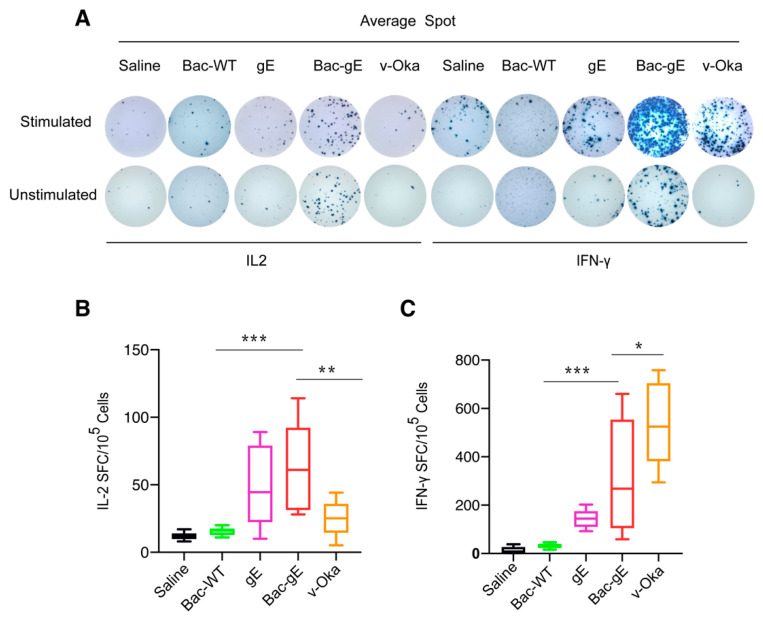
Figure 6.
Elispot assay to evaluate splenocyte secretion of IFN following VZV gE stimulation. (A) Elispot representative images obtained with or without stimulation with one of the four vaccine modalities. (B,C) Quantitative measurements of the number of IL-secreting (B) and IFN-secreting (C) cells, respectively. Results are reported as number of spot-forming cells (SFCs). Data are plotted as box and whiskers. In box and whisker plots, data are presented as min to max whiskers and the median indicated by a horizontal line. One-way ANOVA with Tukey’s multiple comparisons test was used for inter-group statistical comparisons. * p < 0.1, ** p < 0.01, *** p < 0.001. One independent experiment was conducted for Elispot analyses.

